Shrimp Feed Bag Counting Across Warehouse and Ponds
Summary: A security services company supporting shrimp producers needed a reliable way to count ~100 daily feed bags from central warehouse reception to final pond usage. By scanning each bag and associating it with its destination pond, they replaced camera-based manual counting with a fast, auditable barcode workflow producing a structured CSV for daily reconciliation.
Problem context
Feed bags arrive in bulk, are staged, then redistributed to multiple shrimp ponds. Manual video review to “count after the fact” caused delays, disputes, and missed shrinkage. Staff already had Android phones with Wi‑Fi, so the goal became: scan once at movement, capture quantity and destination, and export a clean dataset for inventory + consumption reporting.
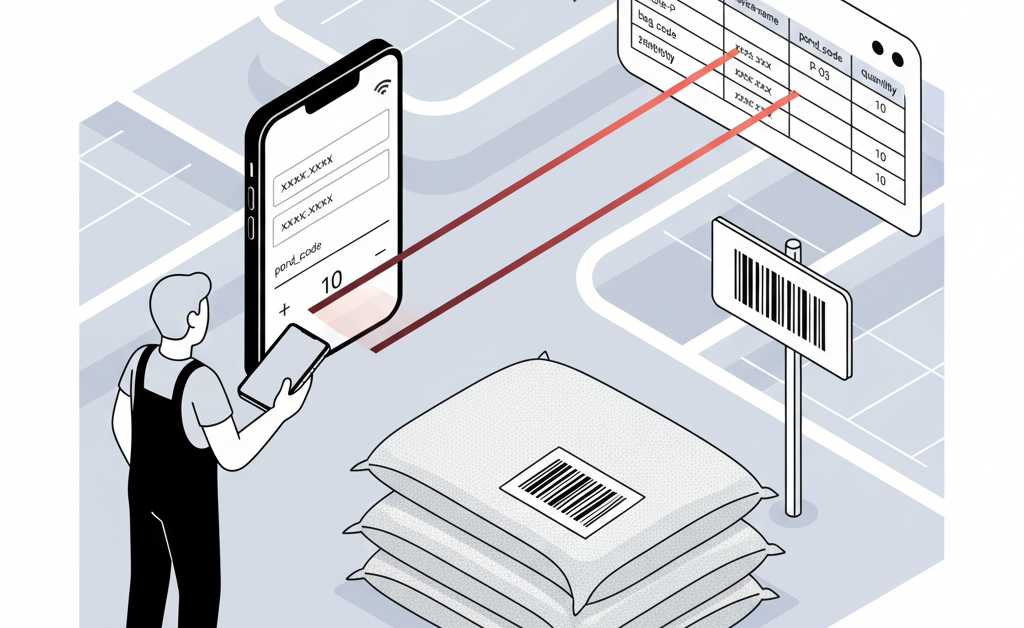
Data captured per bag movement
- Bag / product code (printed barcode on feed bag)
- Pond or zone identifier (barcode at pond gate or printed sheet)
- Quantity (default 1; allow multi-bag bundles if shrink wrapped)
- Timestamp (traceability and shift analysis)
- Device / operator identity (accountability)
Output Template sequence
The Output Template (see how it works) uses core components to emit one CSV row per completed movement:
- BARCODE – feed bag code.
- BARCODE – pond/location code.
- NUMBER – quantity (operator can adjust).
- DATE_TIME – ISO timestamp.
- DEVICE_NAME – device name (maps to operator/shift).
Each component corresponds to a CSV column—no scripting required.
CSV example
timestamp,device_name,bag_code,pond_code,quantity
2025-09-26T07:15:03Z,WH_GATE,FB-40KG-L1,POND_A,1
2025-09-26T07:17:21Z,WH_GATE,FB-40KG-L1,POND_B,2
2025-09-26T07:45:10Z,POND_RUNNER_1,FB-25KG-SP,POND_C,1
Daily reconciliation sums quantity per pond_code and bag_code to detect anomalies versus feeding plans.
Counting workflow
- Operator scans bag code at warehouse exit.
- Scans pond/location barcode on arrival.
- Adjusts quantity if carrying multiple identical bags.
- Row is appended; move to next transfer.
Implementation steps
- Print/affix durable pond/location barcodes where bags are dropped.
- Name each device (Settings → Device Name) to identify operators in exports.
- Create an Output Template inserting components in the sequence above.
- Enable CSV output and set an export interval (e.g., end of shift) or manual export.
- Distribute template to all devices; perform a pilot run for one shift.
Quality controls
- Visual spot check: compare early-morning gate scans versus feed plan.
- Variance detection: sum quantity per pond; investigate unexpected spikes.
- Device accountability: unusual late-night scans traced by device_name.
Results
- Speed: Seconds per movement instead of post-shift video review.
- Accuracy: Direct capture removes manual tally errors.
- Visibility: Near real-time consumption view per pond.
- Scalability: Adding new ponds means adding one barcode.
FAQs
Do we need two BARCODE components? Yes—one for the feed bag, one for the pond/location so each row links product to destination.
Can we add batch or lot? If encoded in the bag barcode it is already captured; otherwise you could later insert another BARCODE or NUMBER field for manual entry (keeping component count lean initially).
How are night shifts handled? Timestamp + device_name allow filtering by shift boundaries when aggregating.
Getting started
- Label ponds with readable barcodes.
- Configure device names.
- Build the Output Template with the five components listed.
- Train one crew; validate CSV aggregates versus manual plan.
- Roll out to all sites and incorporate daily variance reporting.
Next: Create your template and start producing auditable shrimp feed consumption records today. Explore more components in the component library.